
Engagement Rate Calculator
Real benchmarks, real formulas, no guesswork.
Select Platform
Enter Your Stats

Free Engagement Rate Calculator: How to Calculate Your Engagement Rate (2026 Guide)
By the NexusEase Tools Team · Last updated July 2026 · 7 min read
A creator I helped look into her numbers last year had close to 80,000 Instagram followers but could barely pull 200 likes on a normal post. On paper the account looked strong. In reality her engagement rate sat under 0.3% — a clear sign that a good chunk of those followers were inactive or fake. That gap between “looks big” and “actually performs” is exactly what engagement rate is built to expose.
If you post on Instagram, TikTok, YouTube, or Facebook, your follower count doesn’t tell the real story of how your content is doing — engagement rate does. It’s the number brands check before agreeing to a sponsorship, the signal platforms use to decide how far your posts spread, and the clearest proof of whether people actually care about your content instead of just following you and scrolling past it.
This guide walks through exactly how to calculate engagement rate, which formula fits your situation, what counts as “good” in 2026, and what actually moves the number. You can also skip the manual math and run your figures through our free Engagement Rate Calculator for an instant result.
What Is Engagement Rate?
Engagement rate is the percentage of your audience that actively interacts with your content — through likes, comments, shares, saves, or clicks — instead of just scrolling past it. It matters more than raw follower counts because a small, attentive audience of 5,000 people who comment and share will usually outperform 500,000 passive followers who never interact.
Marketers rely on engagement rate for three main reasons:
- Vetting influencers before a paid partnership, to confirm followers are real rather than inflated by bots
- Tracking content performance over time to see what resonates
- Benchmarking against competitors or industry averages in the same niche
Engagement Rate Formula (3 Ways to Calculate It)
There isn’t a single universal formula. Which one you use depends on the data you have available. Here are the three most common methods.
1. Engagement Rate by Followers (most common)
This is the standard formula used by most engagement rate calculators, including tools like Phlanx and HypeAuditor.
Engagement Rate = (Likes + Comments + Shares + Saves) / Total Followers × 100
Worked example: Say a small skincare brand’s Instagram account has 12,400 followers. Their latest Reel pulls in 612 likes, 38 comments, 19 shares, and 41 saves.
- Total engagement = 612 + 38 + 19 + 41 = 710
- 710 ÷ 12,400 × 100 = 5.7% engagement rate
For an account that size, that’s a strong number — well above the 3–5% range most micro accounts see.
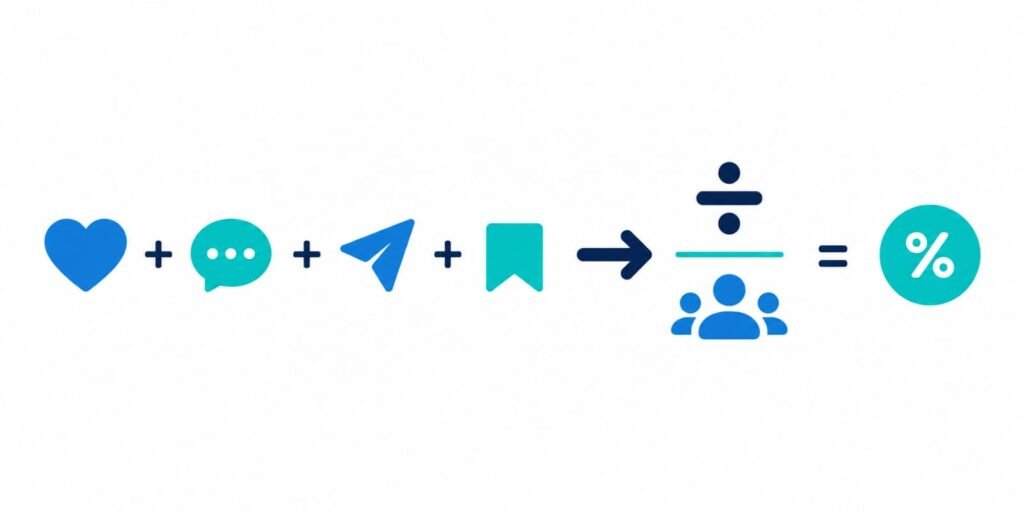
2. Engagement Rate by Reach
Reach is the number of unique accounts that actually saw your post — not everyone who follows you sees every post, thanks to algorithmic feeds. This formula is considered more accurate for judging how compelling a specific post was to the people who saw it.
Engagement Rate (Reach) = Total Engagements / Reach × 100
3. Engagement Rate by Impressions
Impressions count every time content was displayed, including repeat views from the same person. This version is the strictest and is often used to compare paid vs. organic performance.
A1: For most Instagram accounts under 100K followers, 3-5% is considered good, while anything above 6% is excellent. Larger accounts naturally see lower rates, closer to 1-2%.
A2: Almost always — but a rate that’s unusually high compared to a creator’s normal pattern can also indicate engagement pods or bought engagement, so it’s worth checking consistency over several posts rather than judging from one.
A3: This usually happens when follower growth outpaces genuine interest — new followers who don’t actively engage dilute your rate, or the platform’s algorithm is simply showing your content to fewer of your existing followers.
A4: No. Views and impressions measure how many people saw your content, not how they interacted with it. They’re a separate metric from engagement, though some formulas use view count as the denominator specifically for video content.
Engagement Rate (Impressions) = Total Engagements / Total Impressions × 100
Rather than tracking all three manually, plug your numbers into our Engagement Rate Calculator and switch between formulas instantly.
What Counts as “Engagement”?
Every platform weighs actions differently, so it helps to know exactly what to include before you calculate:
| Platform | Counted as Engagement |
| Likes, comments, shares, saves, Story replies | |
| TikTok | Likes, comments, shares, saves |
| Reactions, comments, shares, link clicks | |
| YouTube | Likes, comments, shares (views are separate) |
| Reactions, comments, reposts | |
| X (Twitter) | Likes, retweets, replies |
Passive metrics like views and impressions usually don’t count as engagement on their own — they measure exposure, not interaction.
What Is a Good Engagement Rate in 2026?
Engagement rate benchmarks vary by platform and by audience size — smaller accounts almost always post higher rates than large ones, since niche audiences tend to be more attentive.
General 2026 benchmarks by account size:
- Nano accounts (under 10K followers): 5–8%
- Micro accounts (10K–100K): 3–5%
- Mid-size accounts (100K–500K): 2–3%
- Large accounts (500K+): 1–2%
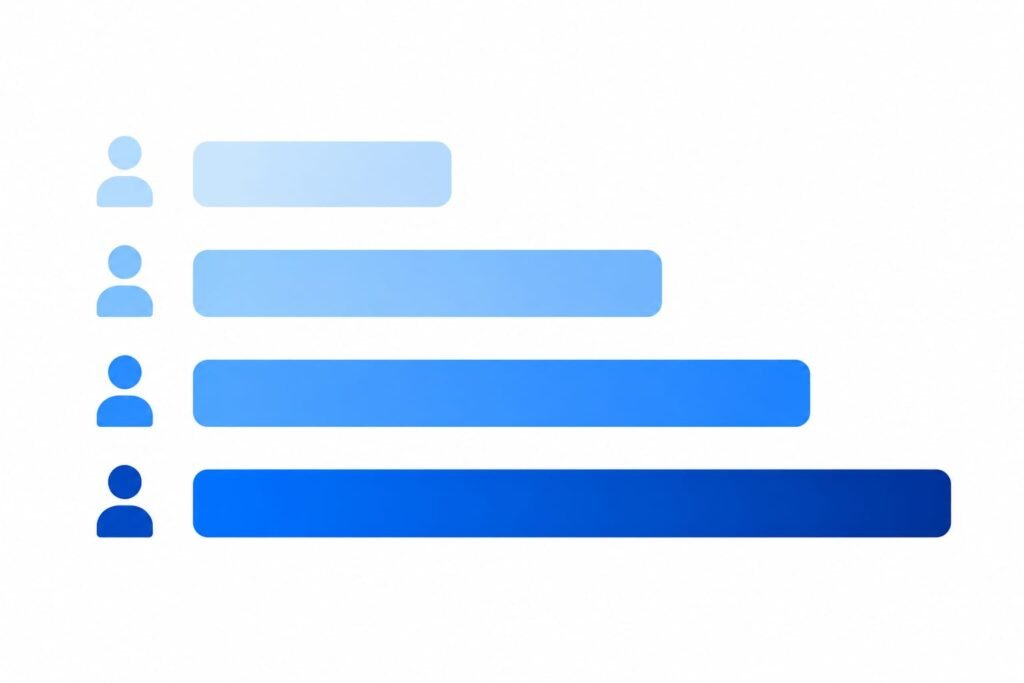
Averaged across all platforms, most accounts fall in the 3–4% range, with the strongest quarter pulling 6–7% and the weakest quarter closer to 2%. Rates also differ sharply by platform — TikTok and Instagram tend to run hotter than Facebook or X, simply because of how each algorithm distributes content.
Rather than chasing a universal number, the most useful benchmark is usually your own past performance. If this month beats last month, you’re moving in the right direction regardless of what the industry average says.
How to Improve Your Engagement Rate
If your number is lower than you’d like, here’s what consistently moves it:

- Ask questions in your captions. Content that invites a reply gets more comments than a plain statement.
- Use Stories/Reels interactive stickers—polls, quizzes, and question boxes —to lower the barrier to engagement.
- Post short-form video. Video formats generally drive more interaction than static images or text because they’re faster to consume and easier to share.
- Reply to every comment, especially in the first hour. Early replies signal to the algorithm that a post is generating conversation, which can boost distribution.
- Post consistently, not just frequently. A predictable schedule builds an audience that shows up expecting your content — volume alone doesn’t fix a weak engagement rate.
- Audit for fake followers. A sudden spike in followers with no matching spike in engagement is a red flag worth investigating, since bot followers permanently drag down your rate.
Frequently Asked Questions
What is a good engagement rate for Instagram? For most Instagram accounts under 100K followers, 3–5% is considered good, while anything above 6% is excellent. Larger accounts naturally see lower rates, closer to 1–2%.
Is a higher engagement rate always better? Almost always — but a rate that’s unusually high compared to a creator’s normal pattern can also indicate engagement pods or bought engagement, so it’s worth checking consistency over several posts rather than judging from one.
Why is my engagement rate dropping even though my followers are growing? This usually happens when follower growth outpaces genuine interest — new followers who don’t actively engage dilute your rate, or the platform’s algorithm is simply showing your content to fewer of your existing followers.
Do views count as engagement? No. Views and impressions measure how many people saw your content, not how they interacted with it. They’re a separate metric from engagement, though some formulas (like engagement rate by views) use view count as the denominator specifically for video content.
Calculate Your Engagement Rate Now
Skip the manual math. Our Engagement Rate Calculator works for Instagram, TikTok, YouTube, Facebook, and X — just enter your followers, likes, comments, and shares to get your rate and see how it compares to 2026 benchmarks.
About this guide: Benchmarks referenced above are drawn from aggregated 2025–2026 social media industry reports and cross-checked against multiple platform-specific sources rather than a single dataset. Formulas are checked against the standard definitions used across the influencer marketing industry. Figures are meant as general guidance — actual “good” performance depends heavily on your niche, platform, and audience size, so treat these as a starting benchmark rather than a hard rule. Have a correction or a benchmark that doesn’t match what you’re seeing in your own analytics? Reach out to the NexusEase team — this guide gets revised as platform behavior changes